Dashboard
The Dashboard is your home base in ACE Report Center. It provides a quick overview of your stores, pending reports, and recent activity.
Dashboard Overview
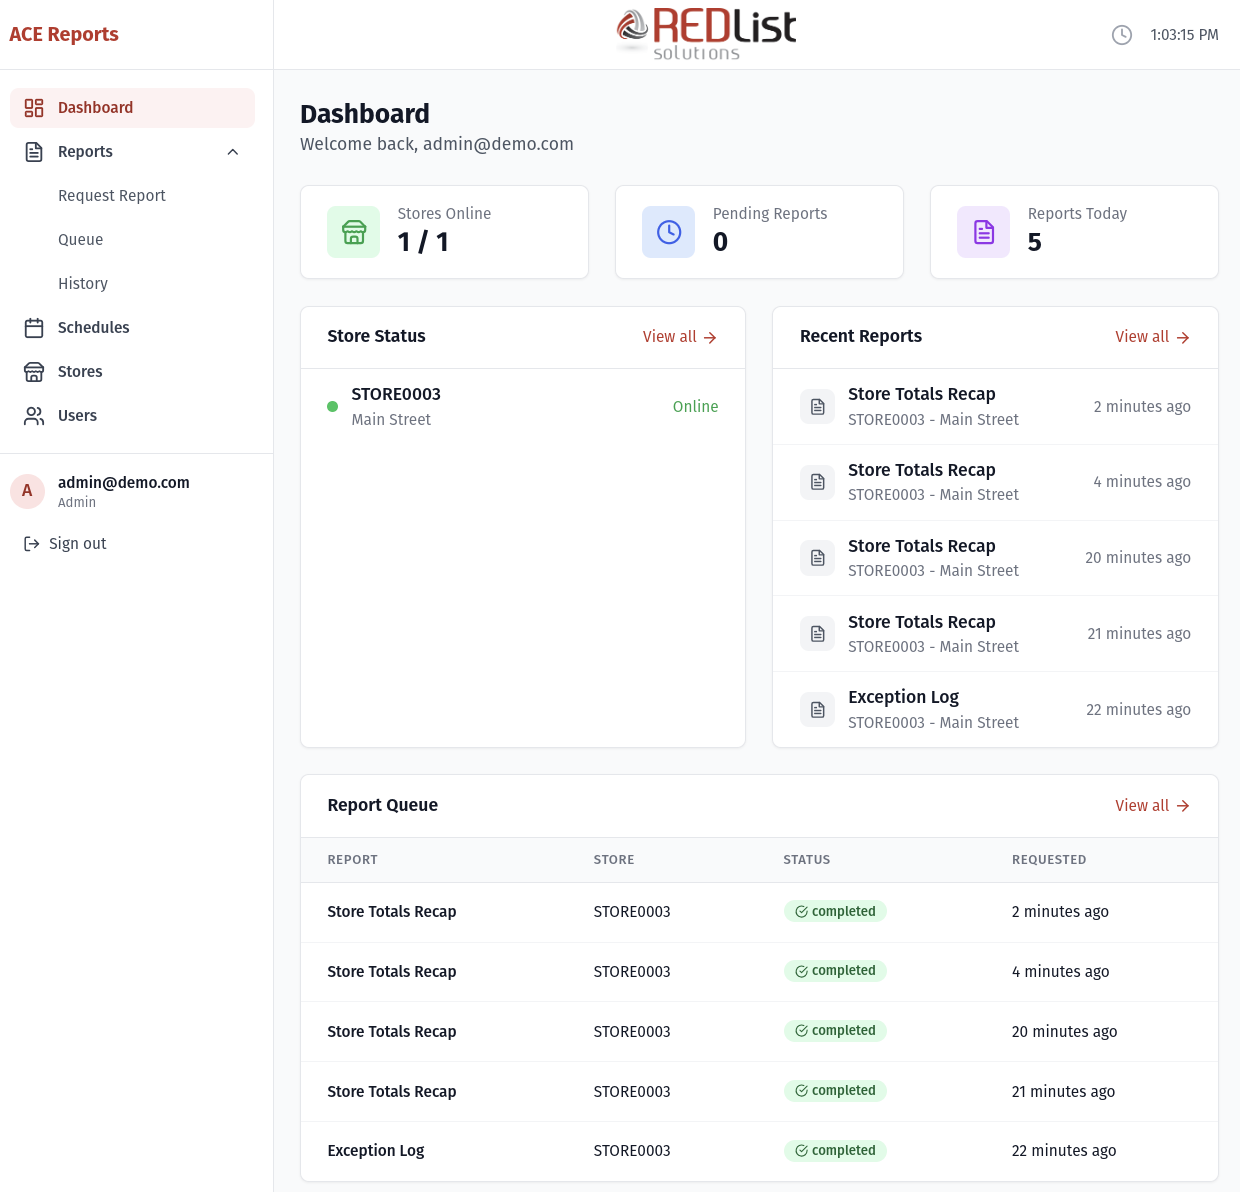
When you first log in, you'll see the Dashboard with several key pieces of information:
Summary Cards
At the top of the Dashboard, you'll see three summary cards:
| Card | What It Shows |
|---|---|
| Stores Online | How many of your stores are currently connected and ready to process reports. Shows as "X / Y" where X is online stores and Y is total stores. |
| Pending Reports | Number of reports waiting to be processed or currently being generated. |
| Reports Today | Number of reports completed today. |
Store Status Panel
This panel shows the connection status of your stores:
- Online stores show a green indicator and "Online" status
- Offline stores show when they were last seen (e.g., "2 hours ago")
Click "View all" to go to the full Stores page for more details.
Recent Reports Panel
Shows the 5 most recently completed reports. Each entry displays:
- Report name
- Store code and name
- When it was completed (e.g., "5 minutes ago")
Click on any report to view it, or click "View all" to see your complete report history.
Report Queue Panel
Shows reports that are waiting or being processed. Status indicators:
- pending - Waiting for a store agent to pick it up
- assigned - A store agent has claimed it and is working on it
- running - The report is being generated
Auto-Refresh
The Dashboard automatically refreshes every 15 seconds, so you'll always see the latest information without needing to manually reload the page.
Quick Actions from Dashboard
From the Dashboard, you can quickly:
- Click a store name to see its details
- Click a recent report to view its contents
- Use the "View all" links to access full lists
- Navigate to other sections using the sidebar